


This content has been archived. It may no longer be relevant
Author: Jake Peters
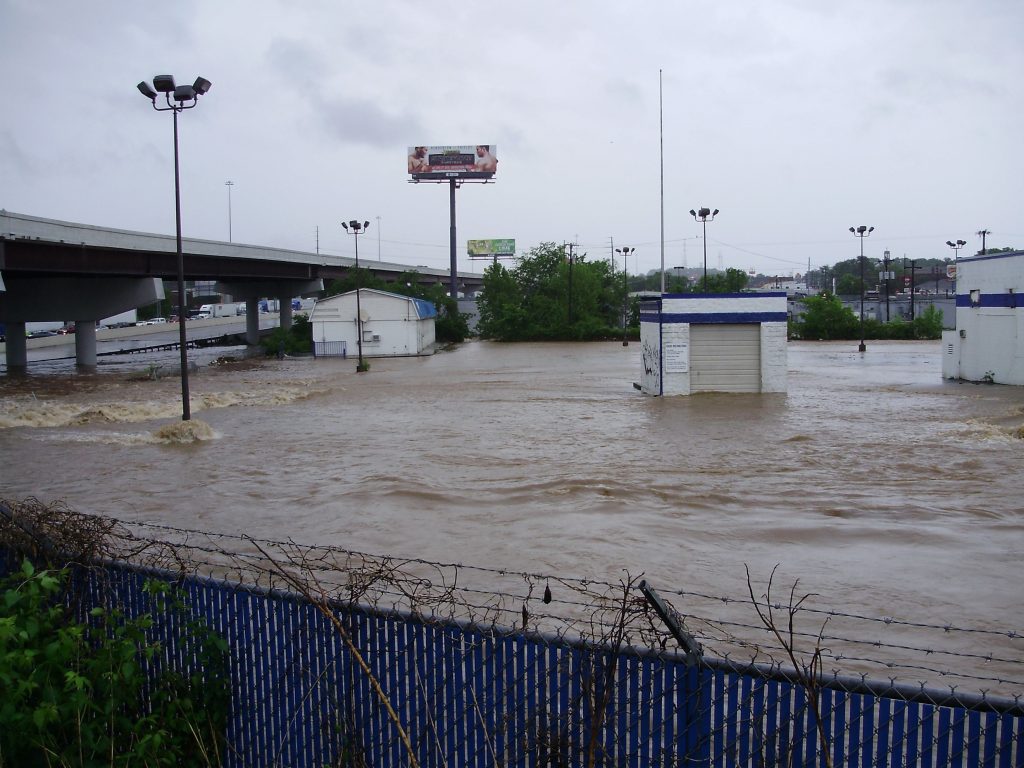
Due to its unique combination of geologic and hydrologic features, Middle Tennessee has long been at an elevated risk for flooding. Traditionally, the public is informed of these dangers through flood maps provided by the Federal Emergency Management Agency (FEMA), a group that works to provide federal assistance in the event of a natural disaster. Relying on a combination of historic hydrologic, land use, and infrastructure data, these maps are used by insurance agencies and real estate agents to evaluate flood risk. In Nashville, FEMA maps were updated in the wake of the historic, 500-year flood that occurred in 2010.
However, despite its 40-year existence, FEMA has yet to provide maps for all areas of the US and does not include enough detail to provide risk assessments for individual properties leaving millions of homeowners unaware of their true risk.
This is the problem that The First Street Foundation, a nonprofit organization focused on providing publicly accessible flood information, attempted to fix through their Flood Factor study. Flood Factor is the first comprehensive, publicly available flood risk model for the United States. Their website (floodfactor.com) provides risk scores (ranging between 1 and 10) and an assessment of individual property’s risk of flooding over a thirty-year period. These scores better inform individual home buyers and property owners about the flood risk to their property compared to a generalized assessments for the region as a whole.
In addition to providing data, Flood Factor takes a much more comprehensive approach when evaluating flood risk than FEMA. It includes environmental changes that impact flood risk (sea level rise, changing precipitation patterns), works to model characteristics of ungauged streams, and finds the flood risk associated with large rain events. These additions to the flood model will provide a more accurate flood assessment/risk into the future as opposed to the FEMA model, which in general does not accurately predict future flood risk.
The differences do not end there! Nationally, Flood Factor identified 1.7x as many properties as being at risk of flooding as FEMA, equating to a total of 14.6 million properties, 5.9 million of which are not designated as high-risk by FEMA. In Tennessee, Flood Factor identified 3.8x as many properties as being at risk of flooding, 280,000 more homes than FEMA.
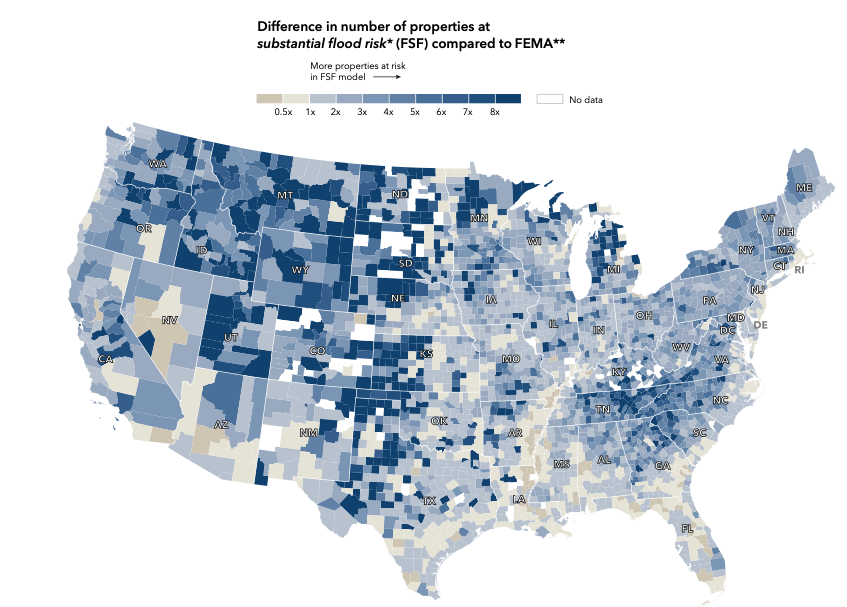
A colorful representation of the differences between Flood Factor and FEMA Flood Maps. Darker areas are home to up to 8x as many at-risk properties as compared to FEMA maps.
As climate change continues to alter the natural landscape, informing oneself about the risks associated with these changes becomes even more important. If you live near a small creek or stream, make sure to check out your property on Flood Factor! To learn more about the ways in which climate change will affect flood risk in the future visit the ‘Environmental Changes’ tab on the Flood Factor website.
Sources & Additional Information:
“Find Your Home’s Flood Factor | Flood Factor”. Flood Factor, 2020, https://floodfactor.com/.
“Floodsmart | FEMA Flood Maps Explained”. Floodsmart.Gov, 2020, https://www.floodsmart.gov/flood-map-zone/about.
Flavelle, Christopher. “New Data Reveals Hidden Flood Risk Across America”. Nytimes.Com, 2020, https://www.nytimes.com/interactive/2020/06/29/climate/hidden-flood-risk-maps.html.
Title photo: Abbington Park neighborhood – Nashville Flood 2010. Credit: Brian Blas